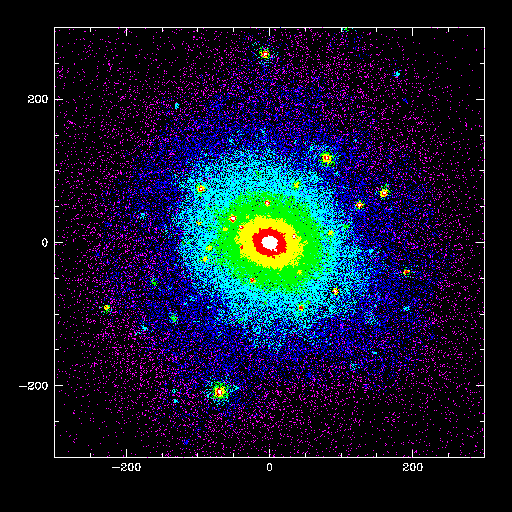
 Figure 1
Dark matter plus gas run. Dark matter particles within a cube of 300 physical kpc on a side shown at redshift z=0 and projected according to the angular momentum of the dark matter only run (fig1b, right). Each particle is colored according to the logarithm of the local dark matter density using a palette that runs from white (Log(\rho) \gt 10^4.8 M_{\odot} kpc^{-3}) to magenta (Log(\rho) \lt 10^1.2 M_{\odot} kpc^{-3}).
|
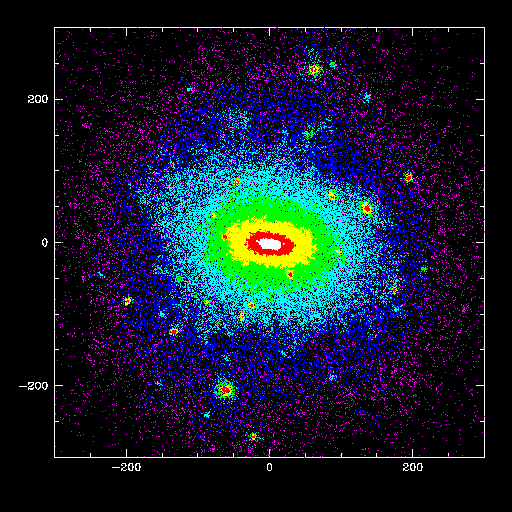 Figure 2
Dark matter only run. Dark matter particles within a cube of 300 physical kpc on a side shown at redshift z=0 and projected according to the angular momentum of the dark matter halo. Each particle is colored according to the logarithm of the local dark matter density using a palette that runs from white (Log(\rho) \gt 10^4.8 M_{\odot} kpc^{-3}) to magenta (Log(\rho) \lt 10^1.2 M_{\odot} kpc^{-3}).
|
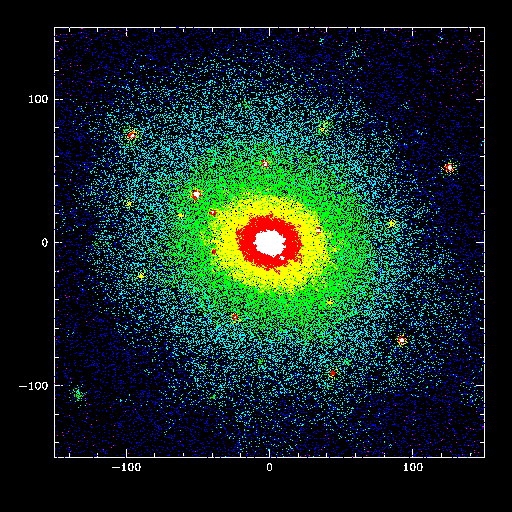 Figure 3
Dark matter plus gas super high res run. Dark matter particles within a cube of 150 physical kpc on a side shown at redshift z=0 and projected according to the angular momentum of the dark matter only run (fig1b, right). Each particle is colored according to the logarithm of the local dark matter density using a palette that runs from white (Log(\rho) \gt 10^4.8 M_{\odot} kpc^{-3}) to magenta (Log(\rho) \lt 10^1.2 M_{\odot} kpc^{-3}).
|
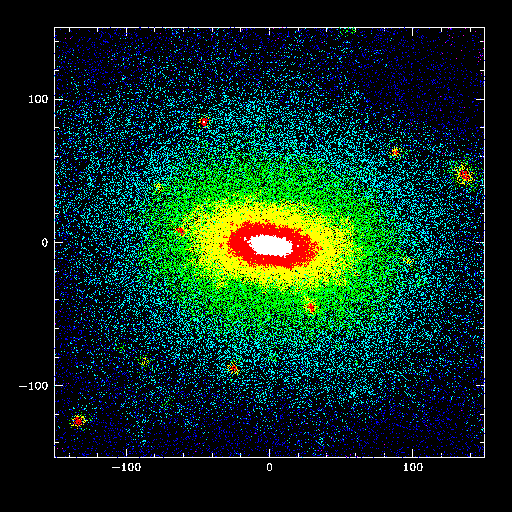 Figure 4
Dark matter only super high res run. Dark matter particles within a cube of 150 physical kpc on a side shown at redshift z=0 and projected according to the angular momentum of the dark matter halo. Each particle is colored according to the logarithm of the local dark matter density using a palette that runs from white (Log(\rho) \gt 10^4.8 M_{\odot} kpc^{-3}) to magenta (Log(\rho) \lt 10^1.2 M_{\odot} kpc^{-3}).
|
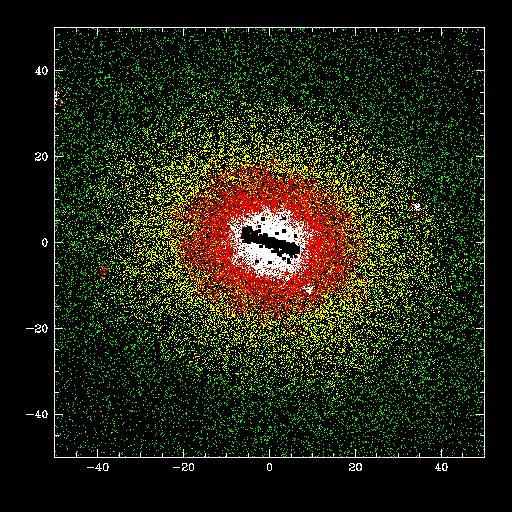 Figure 5
Dark matter plus gas super high res run. Dark matter particles within a cube of 50 physical kpc on a side shown at redshift z=0 and projected according to the angular momentum of the dark matter only run (fig1b, right). Each particle is colored according to the logarithm of the local dark matter density using a palette that runs from white (Log(\rho) \gt 10^4.8 M_{\odot} kpc^{-3}) to magenta (Log(\rho) \lt 10^1.2 M_{\odot} kpc^{-3}).
|
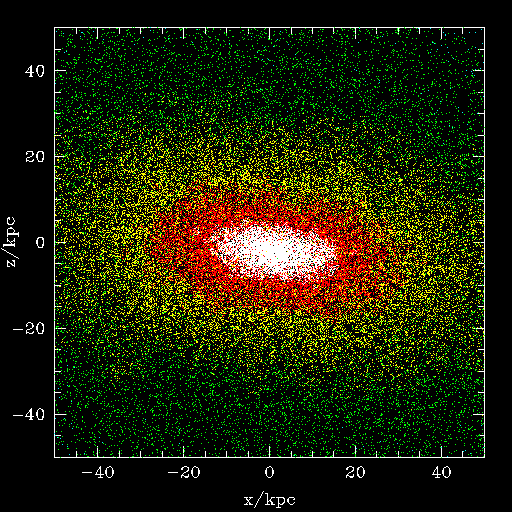 Figure 6
Dark matter only super high res run. Dark matter particles within a cube of 50 physical kpc on a side shown at redshift z=0 and projected according to the angular momentum of the dark matter halo. Each particle is colored according to the logarithm of the local dark matter density using a palette that runs from white (Log(\rho) \gt 10^4.8 M_{\odot} kpc^{-3}) to magenta (Log(\rho) \lt 10^1.2 M_{\odot} kpc^{-3}).
|
 Figure 1a
Dark matter plus gas run. Dark matter particles within a cube of 300 physical kpc on a side shown at redshift z=0 and projected according to the angular momentum of the dark matter only run (fig2b, right). Each particle is colored according to its potential energy.
|
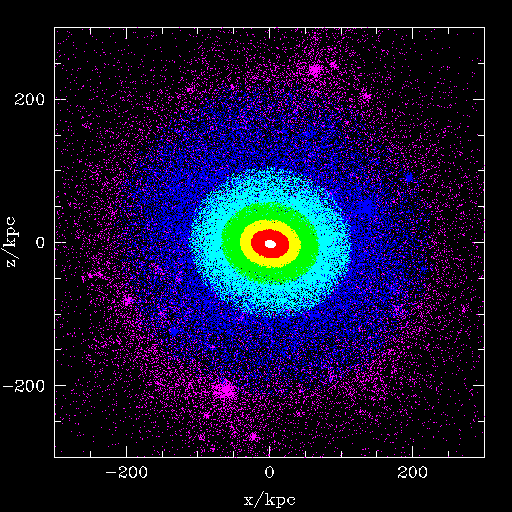 Figure 2a
Dark matter only run. Dark matter particles within a cube of 300 physical kpc on a side shown at redshift z=0 and projected according to the angular momentum of the dark matter halo. Each particle is colored according to its potential energy.
|
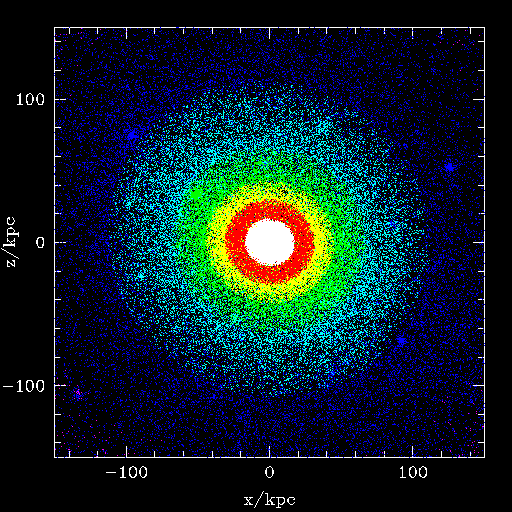 Figure 3a
Dark matter plus gas super high res run. Dark matter particles within a cube of 150 physical kpc on a side shown at redshift z=0 and projected according to the angular momentum of the dark matter only run (fig2b, right). Each particle is colored according to its potential energy.
|
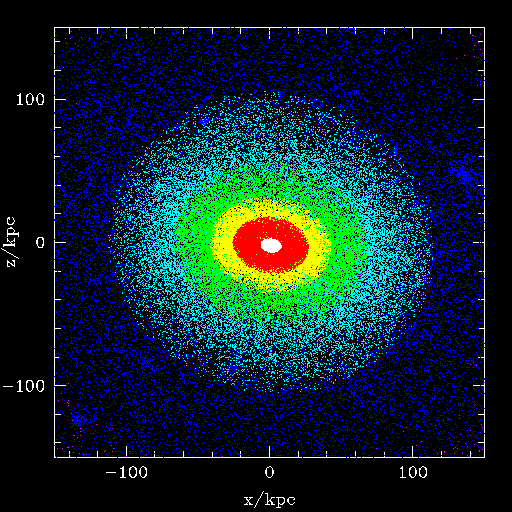 Figure 4a
Dark matter only super high res run. Dark matter particles within a cube of 150 physical kpc on a side shown at redshift z=0 and projected according to the angular momentum of the dark matter halo. Each particle is colored according to its potential energy.
|
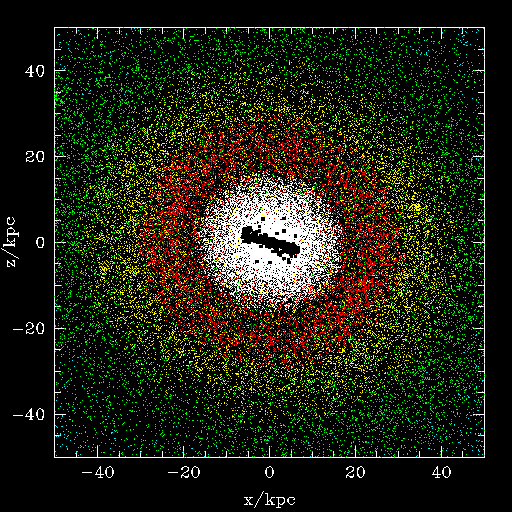 Figure 5a
Dark matter plus gas super high res run. Dark matter particles within a cube of 50 physical kpc on a side shown at redshift z=0 and projected according to the angular momentum of the dark matter only run (fig2b, right). Each particle is colored according to its potential energy.
|
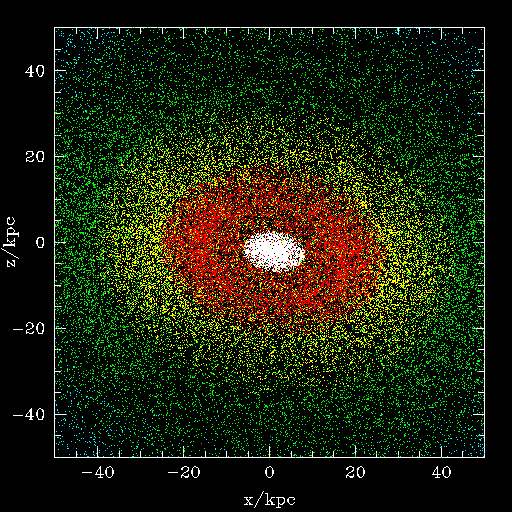 Figure 6a
Dark matter only super high res run. Dark matter particles within a cube of 50 physical kpc on a side shown at redshift z=0 and projected according to the angular momentum of the dark matter halo. Each particle is colored according to its potential energy.
|
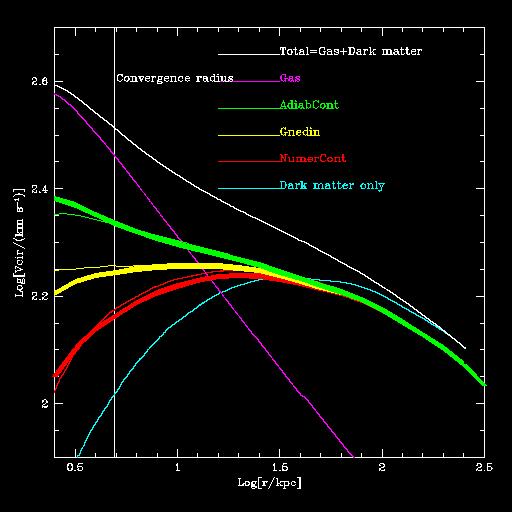 Figure 7
Circular velocity profile for the super high res run. See labels. Thin lines correspond to contra code by Oleg Gnedin for "standard" and "Gnedin" and numerical simulation for "Ours". Thick lines correspond to polynomial fits y=a*x^n for adiabatic contraction.
|
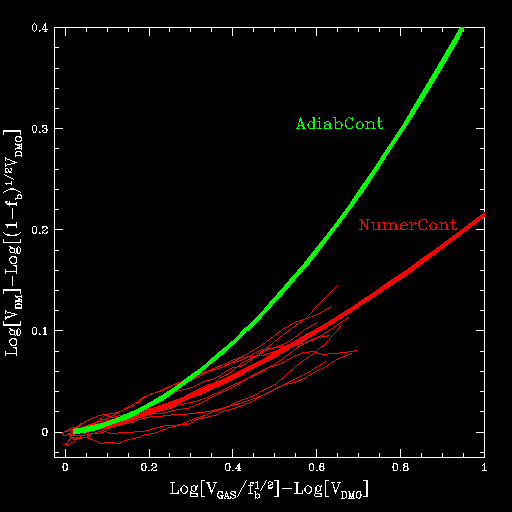 Figure 8
Polinomial fit y=a x^n for the three different models of adiabatic contraction: red=ours, yellow=gnedin and green=standard.
|
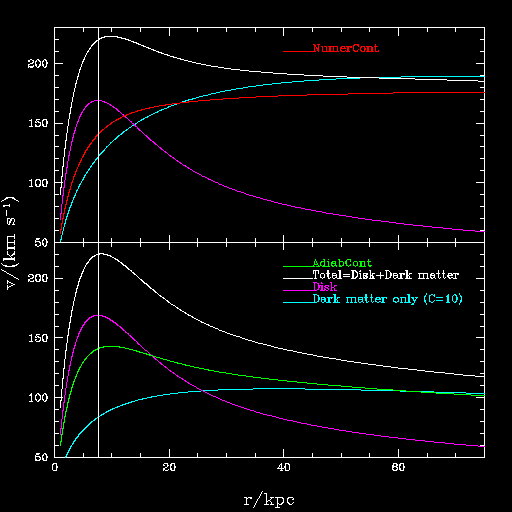 Figure 9
Circular velocity profile for a galaxy similar to the Mikly Way (Mdisk=6e10 M_{\odot} and Rdisk=3.5 kpc) applying three different adiabatic contraction models. The initial dark matter only halo has a concentration c=10 and Mvir=1.9e12 M_{\odot} (Ours), Mvir=1.0e12 M_{\odot} (Gnedin) and Mvir=3.3e11 M_{\odot} (Standard) in order to match Vtot(2.2Rdisk)=220 km/s. For a baryonic fraction f_b=0.02/h^2/0.3=0.136 (LCDM) and Mdisk=6e10 M_{\odot} the virial mass of the Milky Way has to be Mvir > Mdisk/f_b=4.41 e11 M_{\odot}.
|
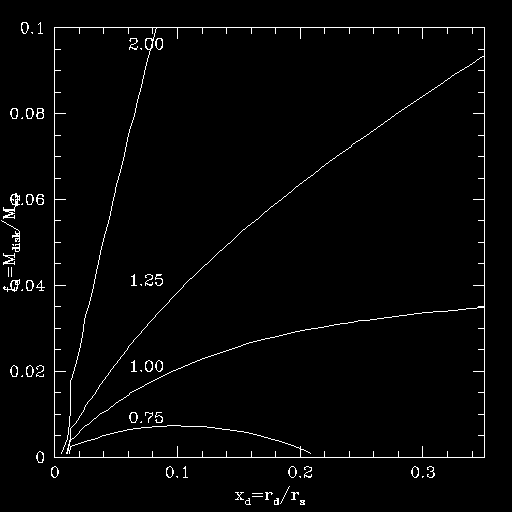 Figure 13
Contour plots of f=Vtot(2.2Rdisk)/Vmax_dmo in the x_d=Rdisk/r_s vs Mdisk/Mvir plane. The curves show 4 different values of f as indicated by the labels using a dark matter halo with a concentration parameter c=10.
|
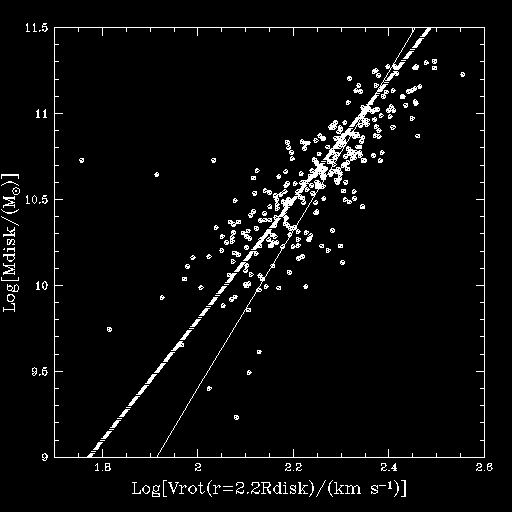 Figure 16
M_{disk} vs V_{rot} relation for galaxies in the Courteau 97 sample adopting a M/L=4. The (dotted thick) line with the lower slope is the baryonic Tully Fisher relation from Bell and De Jong (2001) including gas and the (solid thin) line with the higher slope including only stellar masses.
|
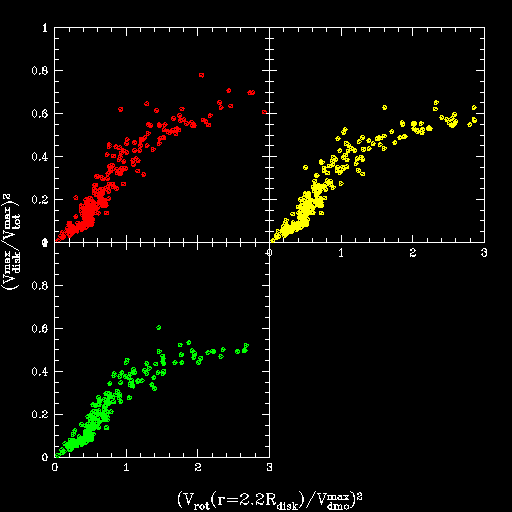 Figure 17
Ratio between V_{disk}^{max} and V_{tot}^{max} versus V_{rot}(r=2.2R_{disk}) and V_{dmo}^{max} for a concetration parameter c=10.
|
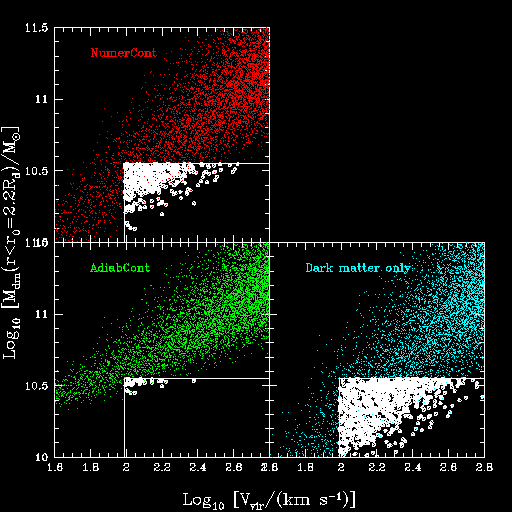 Figure 18
Dark mass enclosed within a radius r_0=2.2Rdisk (the scalelenght of the disk) vs. the virial velocity of the dark matter halos for the Milky Way galaxy (Rdisk=3.5 and Mdisk=6e10 M_{\odot}) computed using concentration parameters c drawn from a lognoral distribution with log_10(c)=1.97-0.077log_10(Mvir/(Msun/h))
and dispersion sigma_(log_10 c)=0.148
|
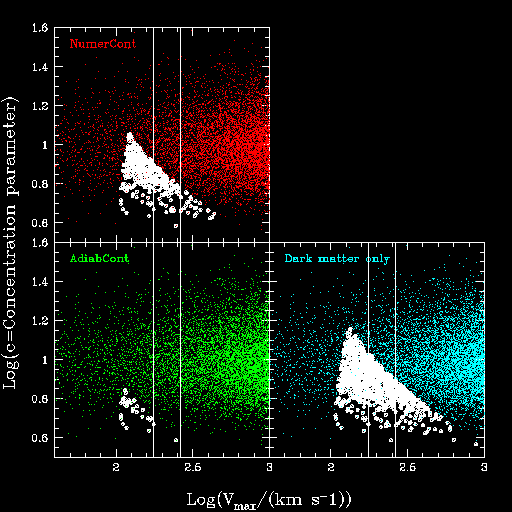 Figure 19
Concentration parameter vs the maximum of the circular velocity of a NFW profile. White dots show those compatible with the restriction imposed in Figure 18.
|
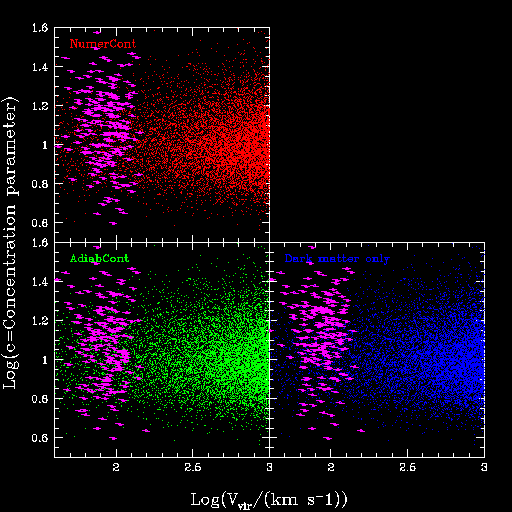 Figure 22a
Concentration parameter vs virial velocity for Courteau's galaxy sample (magenta dots) using a M/L=3 as in Figure 16, using the maximum concentration for white dots of Figure 19.
|
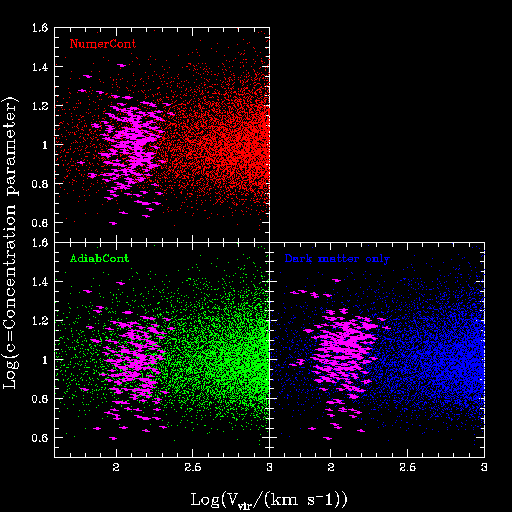 Figure 22b
Concentration parameter vs virial velocity for Courteau's galaxy sample (magenta dots) using a M/L=3 as in Figure 16, using the maximum concentration for white dots of Figure 19 with the additional restriction that 0.8V_{cir} < v_{max} < 1.2 V_{cir}
|
Milky Way Table (M_disk=6e10, R_disk=3.5, V_rot=220)
| OURS | GNEDIN | STANDARD |
| c | M_vir | V_vir | r_vir | M_vir | V_vir | r_vir | M_vir | V_vir | R_vir |
| 05.0 | 0.161E+14 | 324.9 | 656.5 | 0.795E+13 | 256.8 | 518.7 | 0.203E+13 | 162.9 | 329.0 |
| 07.5 | 0.426E+13 | 208.6 | 421.5 | 0.223E+13 | 168.0 | 339.5 | 0.649E+12 | 111.4 | 225.0 |
| 10.0 | 0.181E+13 | 156.8 | 316.7 | 0.998E+12 | 128.6 | 259.8 | 0.326E+12 | 88.6 | 178.9 |
| 12.5 | 0.101E+13 | 128.9 | 260.5 | 0.582E+12 | 107.4 | 217.0 | 0.208E+12 | 76.2 | 153.9 |
| 15.0 | 0.661E+12 | 112.1 | 226.4 | 0.396E+12 | 94.5 | 190.9 | 0.151E+12 | 68.5 | 138.4 |
 Figure 1
Dark matter plus gas run. Dark matter particles within a cube of 300 physical kpc on a side shown at redshift z=0 and projected according to the angular momentum of the dark matter only run (fig1b, right). Each particle is colored according to the logarithm of the local dark matter density using a palette that runs from white (Log(\rho) \gt 10^4.8 M_{\odot} kpc^{-3}) to magenta (Log(\rho) \lt 10^1.2 M_{\odot} kpc^{-3}).
 Figure 2
Dark matter only run. Dark matter particles within a cube of 300 physical kpc on a side shown at redshift z=0 and projected according to the angular momentum of the dark matter halo. Each particle is colored according to the logarithm of the local dark matter density using a palette that runs from white (Log(\rho) \gt 10^4.8 M_{\odot} kpc^{-3}) to magenta (Log(\rho) \lt 10^1.2 M_{\odot} kpc^{-3}).
 Figure 3
Dark matter plus gas super high res run. Dark matter particles within a cube of 150 physical kpc on a side shown at redshift z=0 and projected according to the angular momentum of the dark matter only run (fig1b, right). Each particle is colored according to the logarithm of the local dark matter density using a palette that runs from white (Log(\rho) \gt 10^4.8 M_{\odot} kpc^{-3}) to magenta (Log(\rho) \lt 10^1.2 M_{\odot} kpc^{-3}).
 Figure 4
Dark matter only super high res run. Dark matter particles within a cube of 150 physical kpc on a side shown at redshift z=0 and projected according to the angular momentum of the dark matter halo. Each particle is colored according to the logarithm of the local dark matter density using a palette that runs from white (Log(\rho) \gt 10^4.8 M_{\odot} kpc^{-3}) to magenta (Log(\rho) \lt 10^1.2 M_{\odot} kpc^{-3}).
 Figure 5
Dark matter plus gas super high res run. Dark matter particles within a cube of 50 physical kpc on a side shown at redshift z=0 and projected according to the angular momentum of the dark matter only run (fig1b, right). Each particle is colored according to the logarithm of the local dark matter density using a palette that runs from white (Log(\rho) \gt 10^4.8 M_{\odot} kpc^{-3}) to magenta (Log(\rho) \lt 10^1.2 M_{\odot} kpc^{-3}).
 Figure 6
Dark matter only super high res run. Dark matter particles within a cube of 50 physical kpc on a side shown at redshift z=0 and projected according to the angular momentum of the dark matter halo. Each particle is colored according to the logarithm of the local dark matter density using a palette that runs from white (Log(\rho) \gt 10^4.8 M_{\odot} kpc^{-3}) to magenta (Log(\rho) \lt 10^1.2 M_{\odot} kpc^{-3}).
 Figure 1a
Dark matter plus gas run. Dark matter particles within a cube of 300 physical kpc on a side shown at redshift z=0 and projected according to the angular momentum of the dark matter only run (fig2b, right). Each particle is colored according to its potential energy.
 Figure 2a
Dark matter only run. Dark matter particles within a cube of 300 physical kpc on a side shown at redshift z=0 and projected according to the angular momentum of the dark matter halo. Each particle is colored according to its potential energy.
 Figure 3a
Dark matter plus gas super high res run. Dark matter particles within a cube of 150 physical kpc on a side shown at redshift z=0 and projected according to the angular momentum of the dark matter only run (fig2b, right). Each particle is colored according to its potential energy.
 Figure 4a
Dark matter only super high res run. Dark matter particles within a cube of 150 physical kpc on a side shown at redshift z=0 and projected according to the angular momentum of the dark matter halo. Each particle is colored according to its potential energy.
 Figure 5a
Dark matter plus gas super high res run. Dark matter particles within a cube of 50 physical kpc on a side shown at redshift z=0 and projected according to the angular momentum of the dark matter only run (fig2b, right). Each particle is colored according to its potential energy.
 Figure 6a
Dark matter only super high res run. Dark matter particles within a cube of 50 physical kpc on a side shown at redshift z=0 and projected according to the angular momentum of the dark matter halo. Each particle is colored according to its potential energy.
 Figure 7
Circular velocity profile for the super high res run. See labels. Thin lines correspond to contra code by Oleg Gnedin for "standard" and "Gnedin" and numerical simulation for "Ours". Thick lines correspond to polynomial fits y=a*x^n for adiabatic contraction.
 Figure 8
Polinomial fit y=a x^n for the three different models of adiabatic contraction: red=ours, yellow=gnedin and green=standard.
 Figure 9
Circular velocity profile for a galaxy similar to the Mikly Way (Mdisk=6e10 M_{\odot} and Rdisk=3.5 kpc) applying three different adiabatic contraction models. The initial dark matter only halo has a concentration c=10 and Mvir=1.9e12 M_{\odot} (Ours), Mvir=1.0e12 M_{\odot} (Gnedin) and Mvir=3.3e11 M_{\odot} (Standard) in order to match Vtot(2.2Rdisk)=220 km/s. For a baryonic fraction f_b=0.02/h^2/0.3=0.136 (LCDM) and Mdisk=6e10 M_{\odot} the virial mass of the Milky Way has to be Mvir > Mdisk/f_b=4.41 e11 M_{\odot}.
 Figure 13
Contour plots of f=Vtot(2.2Rdisk)/Vmax_dmo in the x_d=Rdisk/r_s vs Mdisk/Mvir plane. The curves show 4 different values of f as indicated by the labels using a dark matter halo with a concentration parameter c=10.
 Figure 16
M_{disk} vs V_{rot} relation for galaxies in the Courteau 97 sample adopting a M/L=4. The (dotted thick) line with the lower slope is the baryonic Tully Fisher relation from Bell and De Jong (2001) including gas and the (solid thin) line with the higher slope including only stellar masses.
 Figure 17
Ratio between V_{disk}^{max} and V_{tot}^{max} versus V_{rot}(r=2.2R_{disk}) and V_{dmo}^{max} for a concetration parameter c=10.
 Figure 18
Dark mass enclosed within a radius r_0=2.2Rdisk (the scalelenght of the disk) vs. the virial velocity of the dark matter halos for the Milky Way galaxy (Rdisk=3.5 and Mdisk=6e10 M_{\odot}) computed using concentration parameters c drawn from a lognoral distribution with log_10(c)=1.97-0.077log_10(Mvir/(Msun/h))
and dispersion sigma_(log_10 c)=0.148
 Figure 19
Concentration parameter vs the maximum of the circular velocity of a NFW profile. White dots show those compatible with the restriction imposed in Figure 18.
 Figure 22a
Concentration parameter vs virial velocity for Courteau's galaxy sample (magenta dots) using a M/L=3 as in Figure 16, using the maximum concentration for white dots of Figure 19.
 Figure 22b
Concentration parameter vs virial velocity for Courteau's galaxy sample (magenta dots) using a M/L=3 as in Figure 16, using the maximum concentration for white dots of Figure 19 with the additional restriction that 0.8V_{cir} < v_{max} < 1.2 V_{cir}