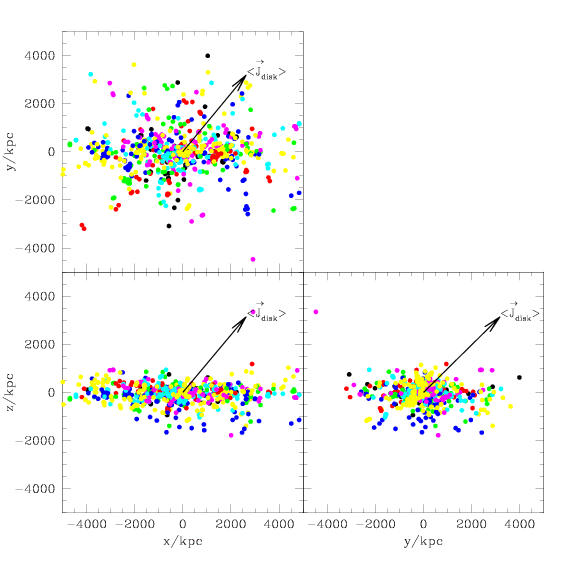
 Projected distribution of all high res satellites.
|
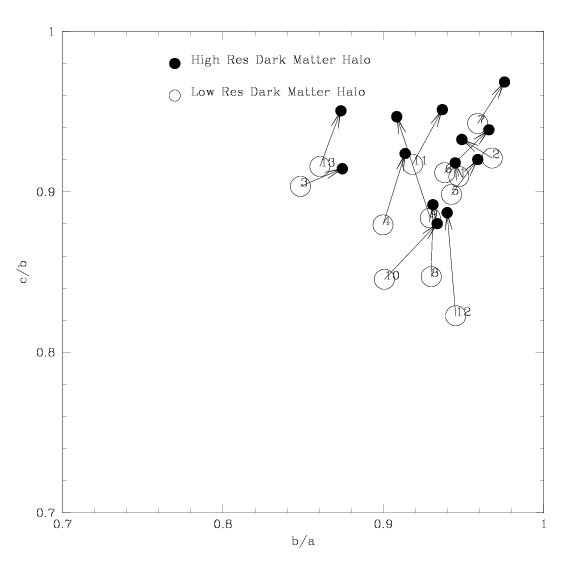
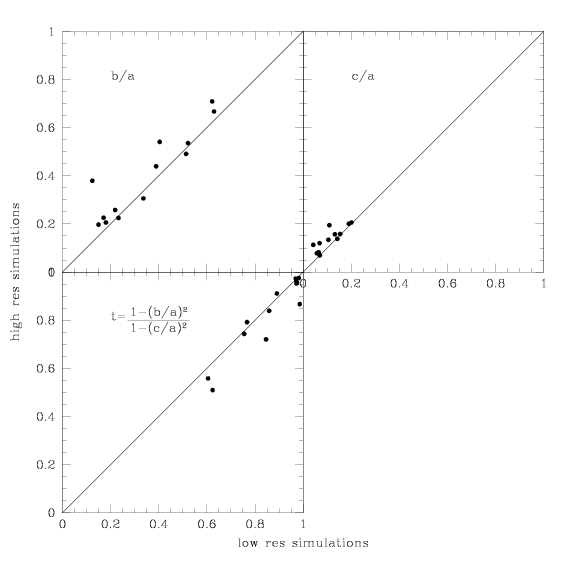 Correlation of satellite axis ratio for low res vs high res simulation.
|
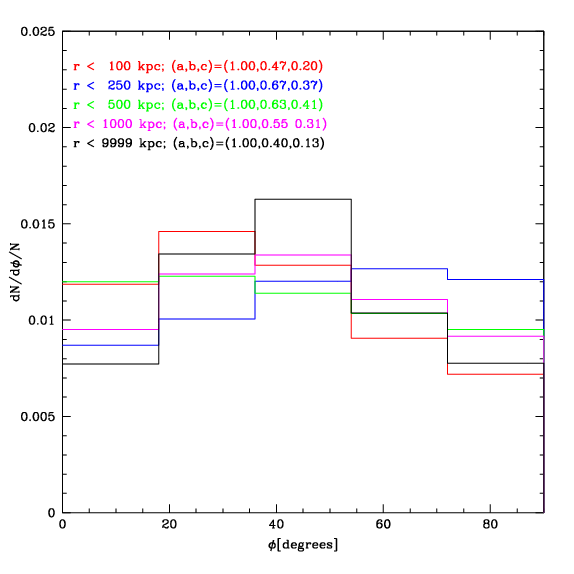 Distribution of angles for an ellipsoidal model (spherical homogeneous distribution
shrinked by (a,b,c) factor in each direction).
|
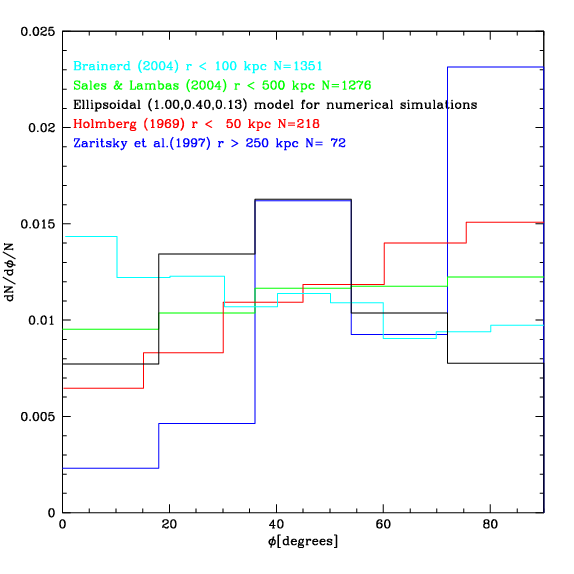 Holmberg effect for different samples.
|
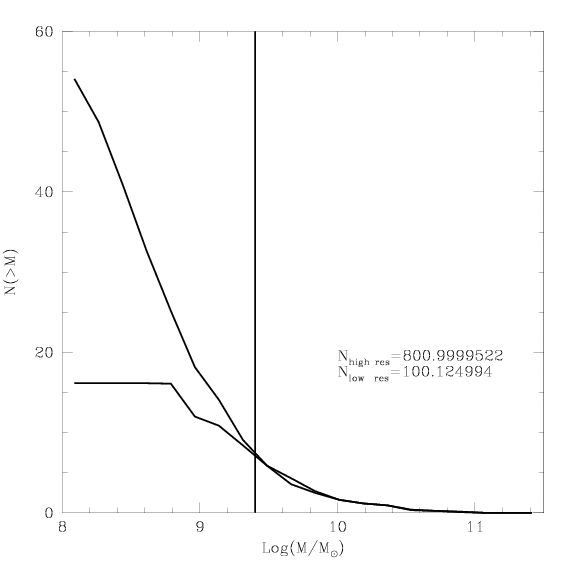 Cumulative number distribution of satellite mass for high and low res simulations.
|
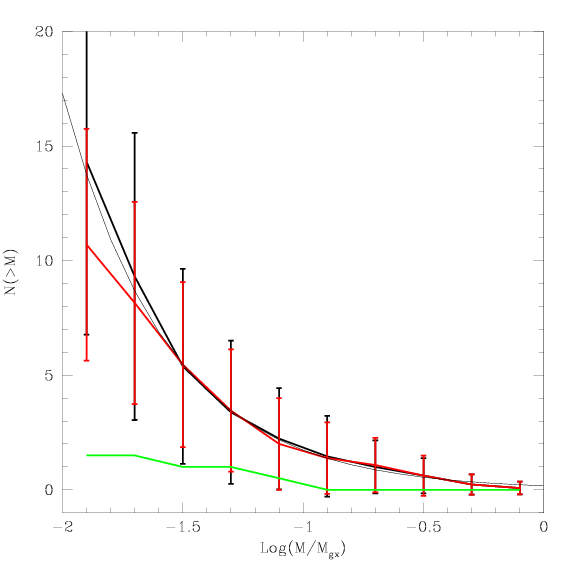 Cumulative number distribution of normalized mass for satellites, black=high res simulation, red=low res simulation, green=local group, thin line is a model dN/dm~m^(-alpha))
|
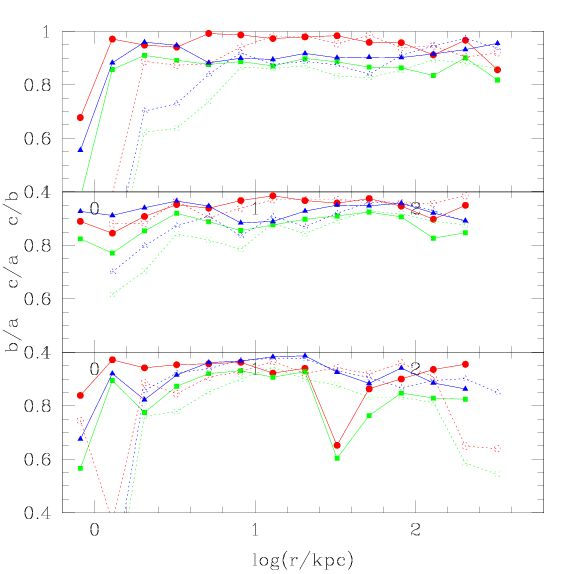
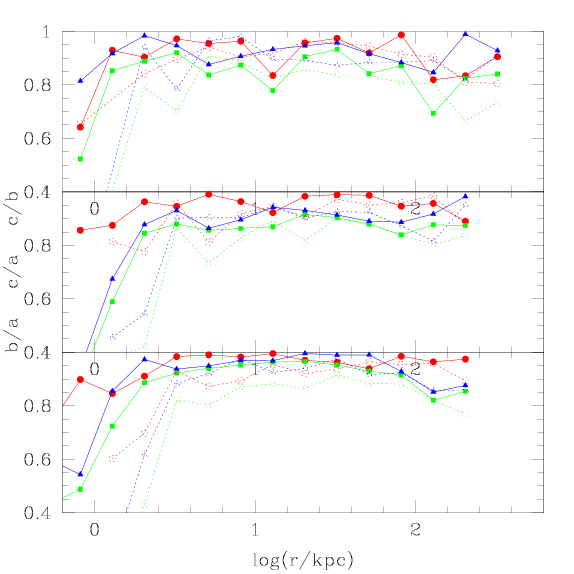
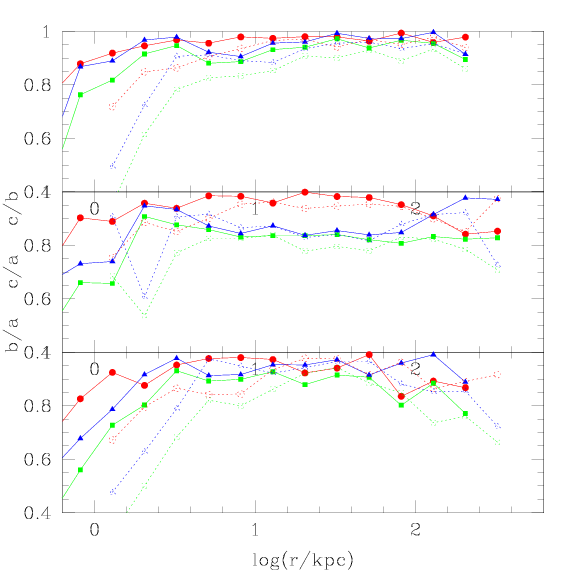
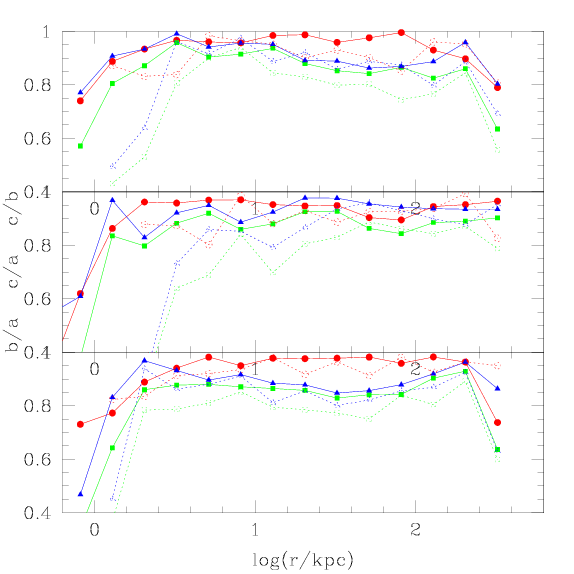
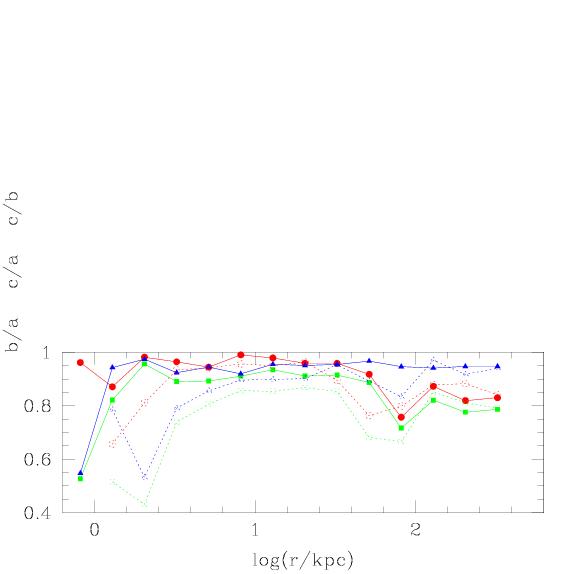
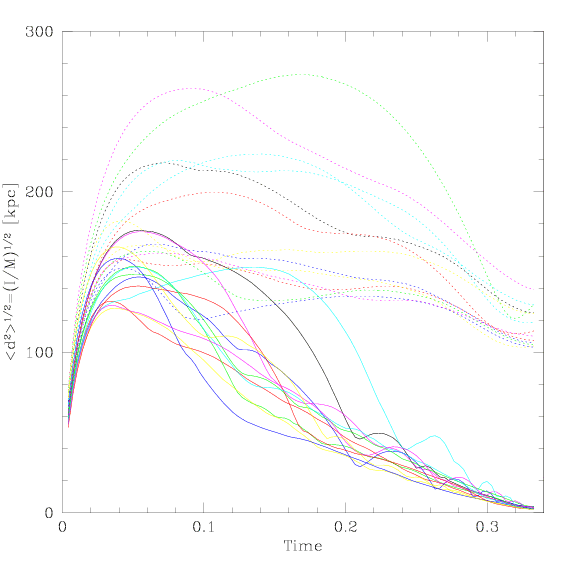 Dotted lines=Halo (dark matter), Solid lines=Disk (gas)
|
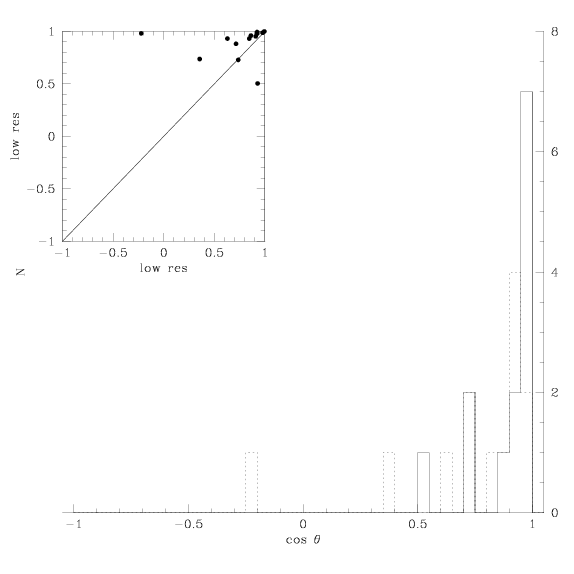 Distribution of cosine angle between disk and halo angular momentum vector at final output. Inset panel correlation between low and high res simu.
|
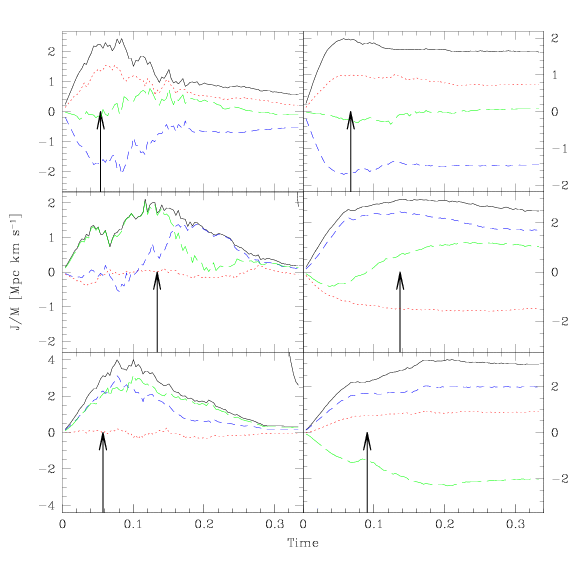
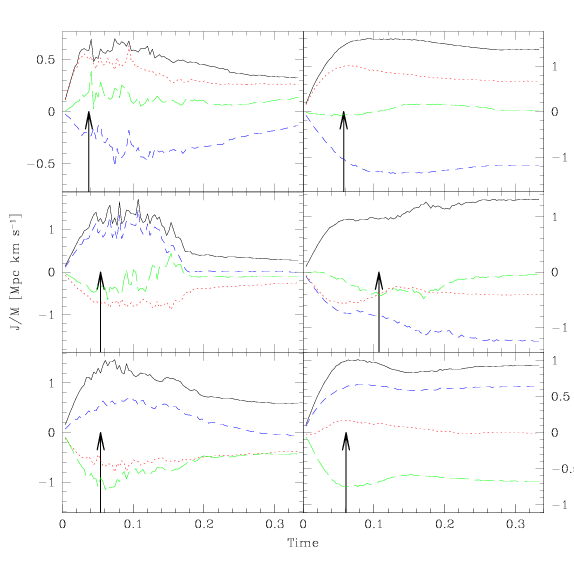
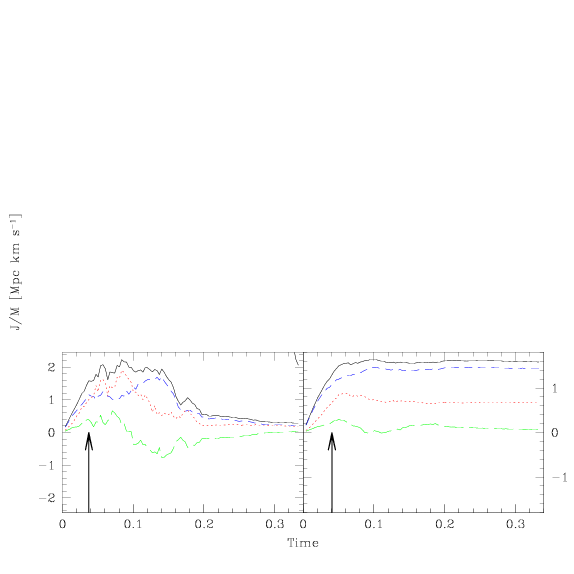
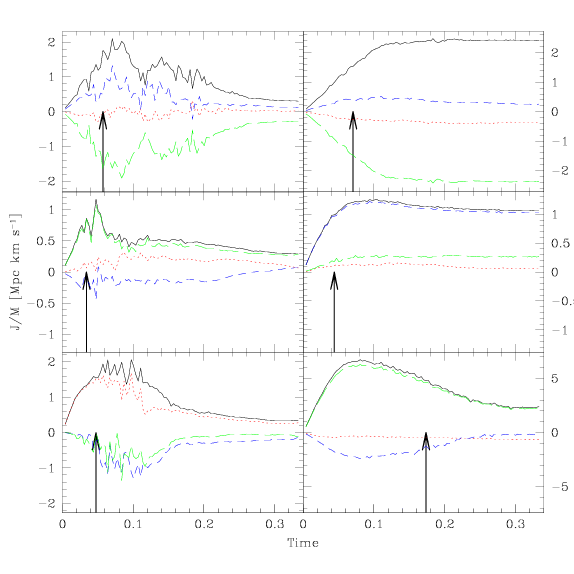
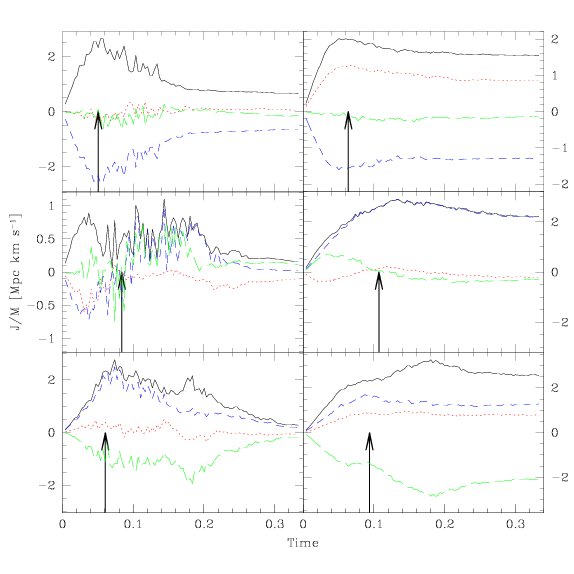
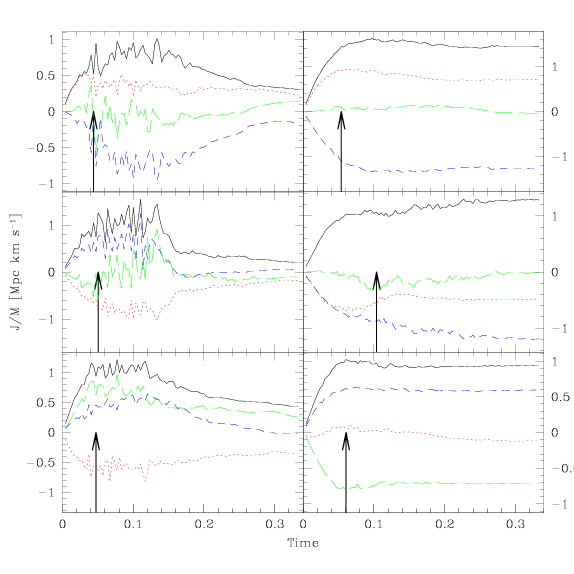
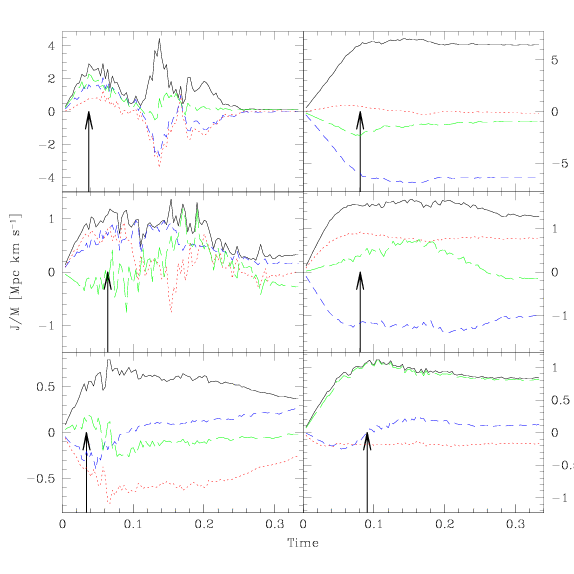
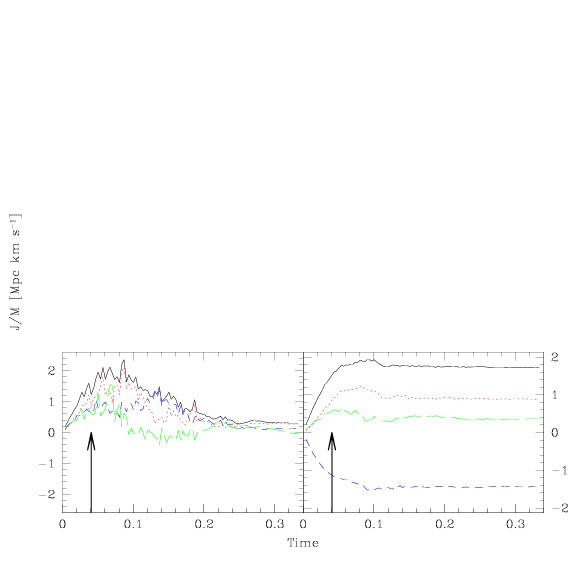
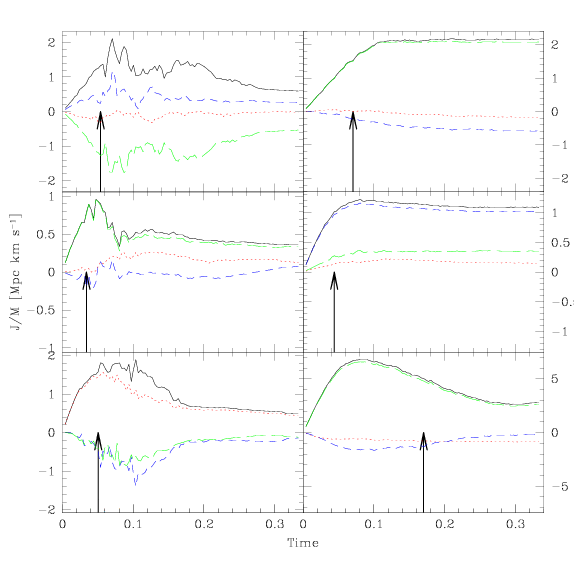 Specific angular momentum evolution , left colums are Disk, right colums are Halo
Rotated according turnaround axes (jx=red, jy=blue, jz=green, total=black).
|
|
|

|
|
|
|
|
|
|
|
|
|
|
|
|
 Projected distribution of all high res satellites.
 Correlation of satellite axis ratio for low res vs high res simulation.
 Distribution of angles for an ellipsoidal model (spherical homogeneous distribution
shrinked by (a,b,c) factor in each direction).
 Holmberg effect for different samples.
 Cumulative number distribution of satellite mass for high and low res simulations.
 Cumulative number distribution of normalized mass for satellites, black=high res simulation, red=low res simulation, green=local group, thin line is a model dN/dm~m^(-alpha))
 Dotted lines=Halo (dark matter), Solid lines=Disk (gas)
 Distribution of cosine angle between disk and halo angular momentum vector at final output. Inset panel correlation between low and high res simu.
 Specific angular momentum evolution , left colums are Disk, right colums are Halo
Rotated according turnaround axes (jx=red, jy=blue, jz=green, total=black).


